Implementation Effort
- Requires moderate effort
- Timeline between 4-6 weeks*
* Assuming an agency has an existing, configured AASHTOWare Safety instance and all required data
Our Customer Success team helps agencies turn crash data into actionable insights. The processes below show how they’re making their communities safer.
The Idaho Transportation Department partners with educators across the state to incorporate crash data into their curriculum.
* Assuming an agency has an existing, configured AASHTOWare Safety instance and all required data
The Idaho Transportation Department and the Idaho STEM Action Center have worked together to build the “Do the Math, Save a Life” math education curriculum that helps students use real-world crash data to explore basic statistical measures, and form stories to understand the impact of crashes in their communities. This innovative initiative provides opportunities for young drivers across the state to interact with crash data through Idaho’s public-facing crash data dashboards.
Using this resource, students identify high crash locations and generate data-driven safety recommendations. This not only increases safety awareness among a high-risk demographic of drivers but also introduces the field of transportation safety to the next generation of safety engineers.
“Using the ITD Crash Data Dashboard, calculate the average rate of deaths per crash in your county vs another county of a significantly different size (eg, Ada County vs Bonneville County). Why might one county have a lower rate than the other? Is it safer to drive in our county than to drive in the other county? What situations have the highest fatality rates?”
–Do the Math, Save A Life Curriculum – Lesson 1: ITD Crash Data Scavenger Hunt.
Idaho’s public-facing crash data dashboards make crash data easily accessible to users across the state. Using these dashboards, young drivers are able to answer basic safety questions such as:
Using public dashboards, users can select intersections or roads in their community and report on crash patterns at those locations.
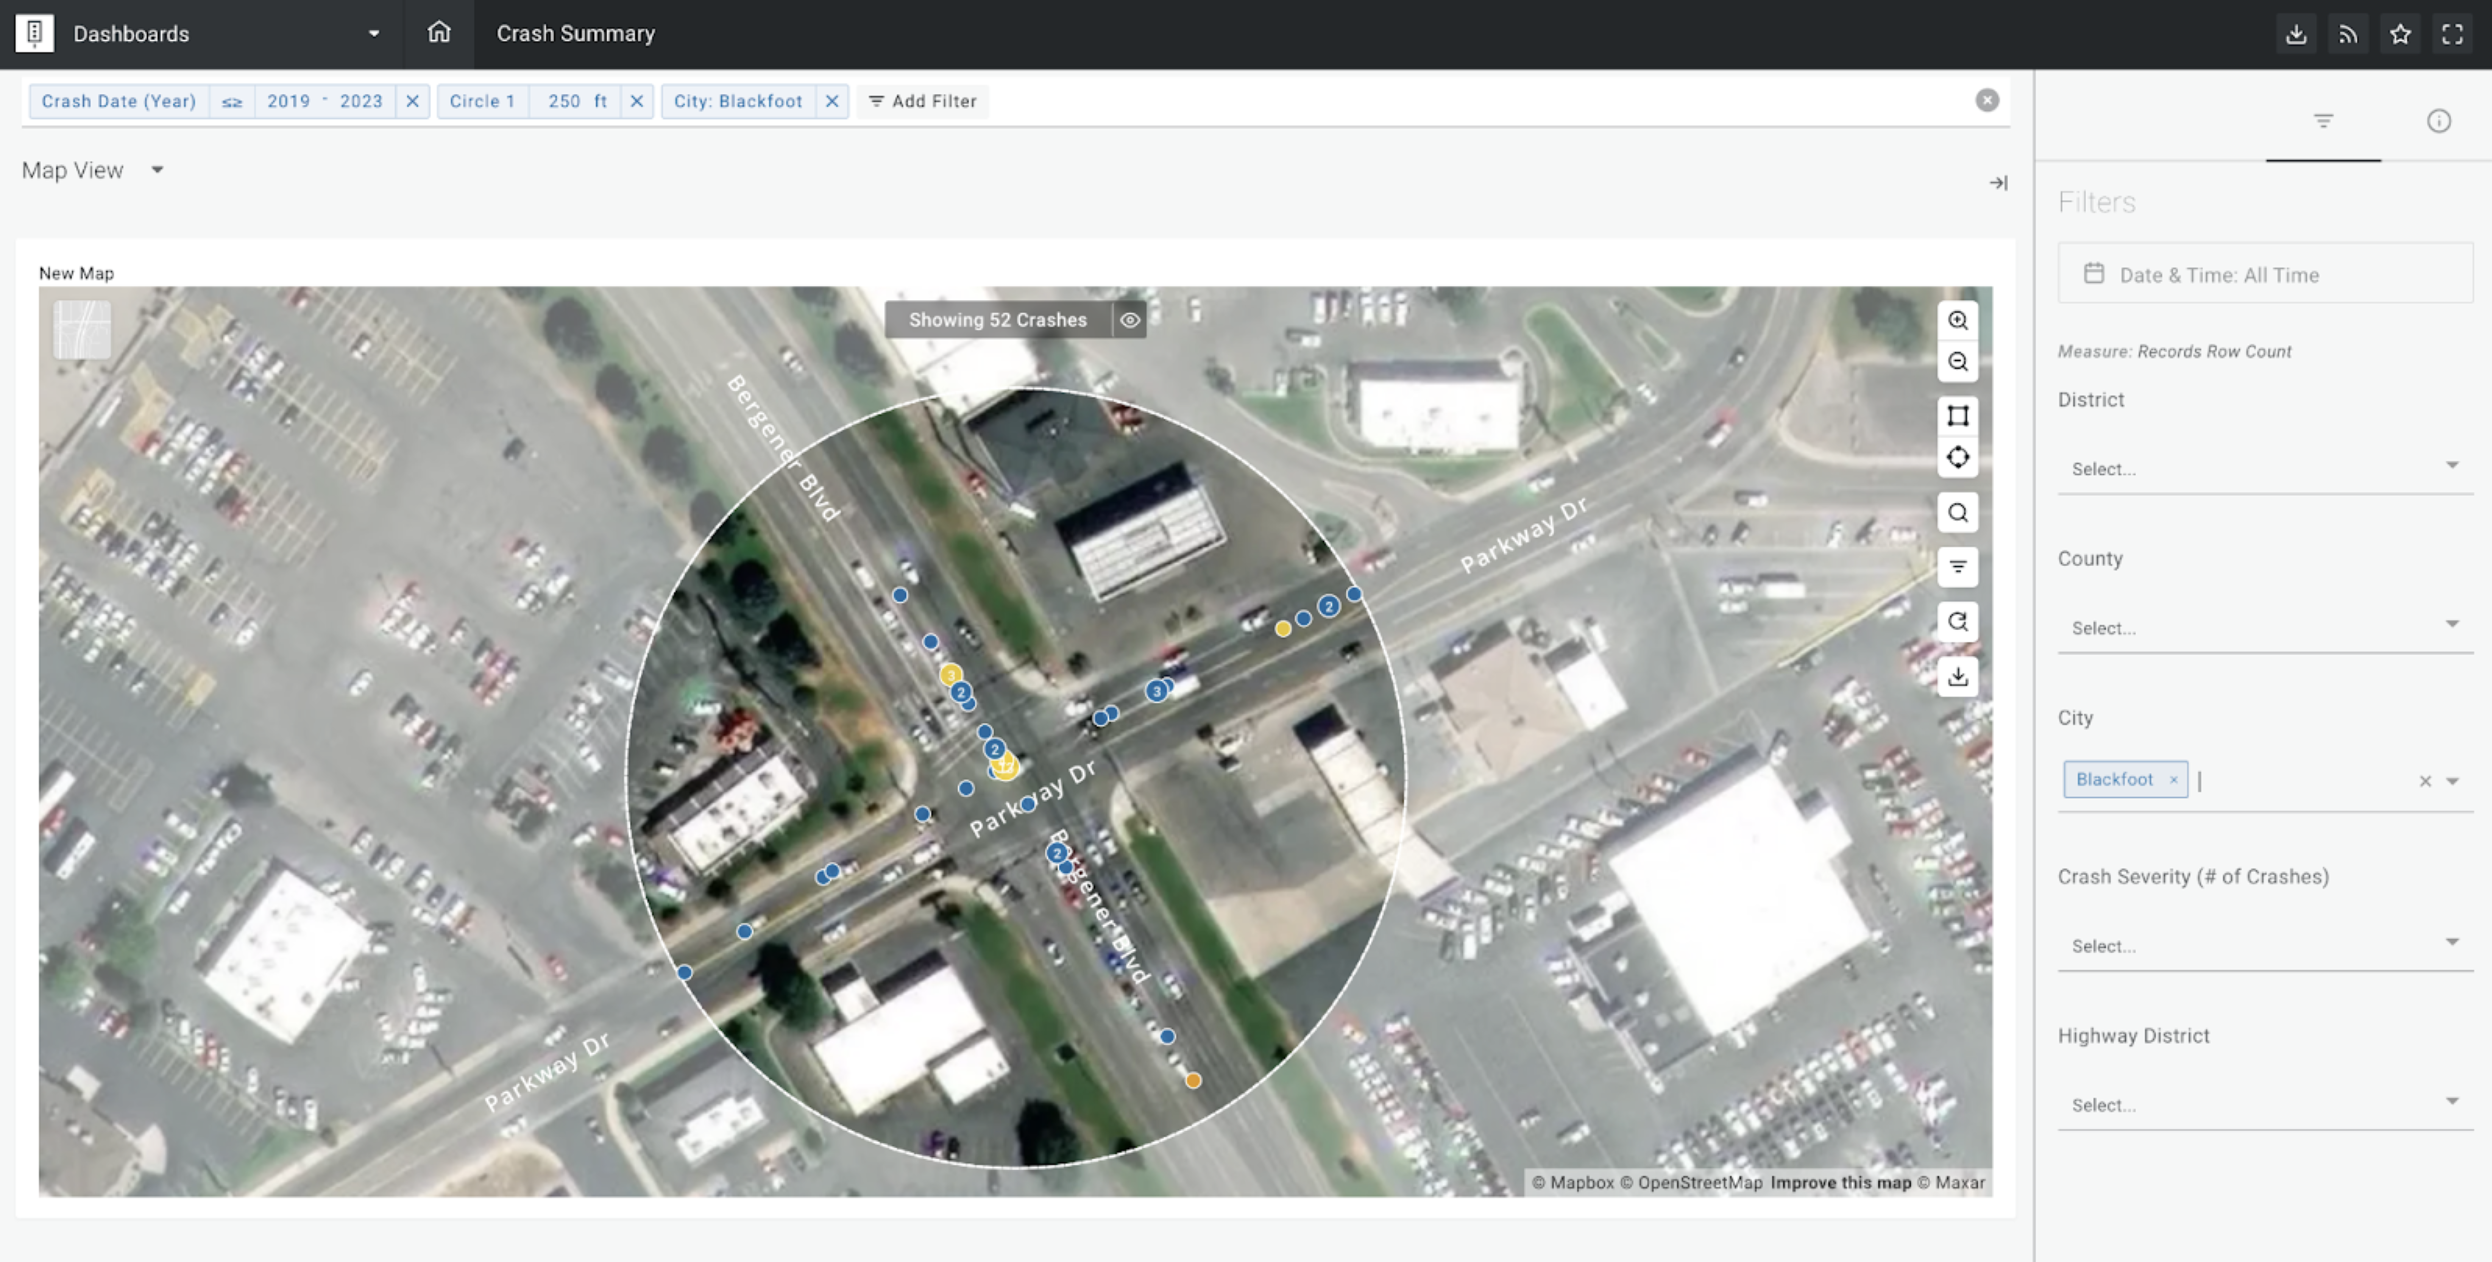
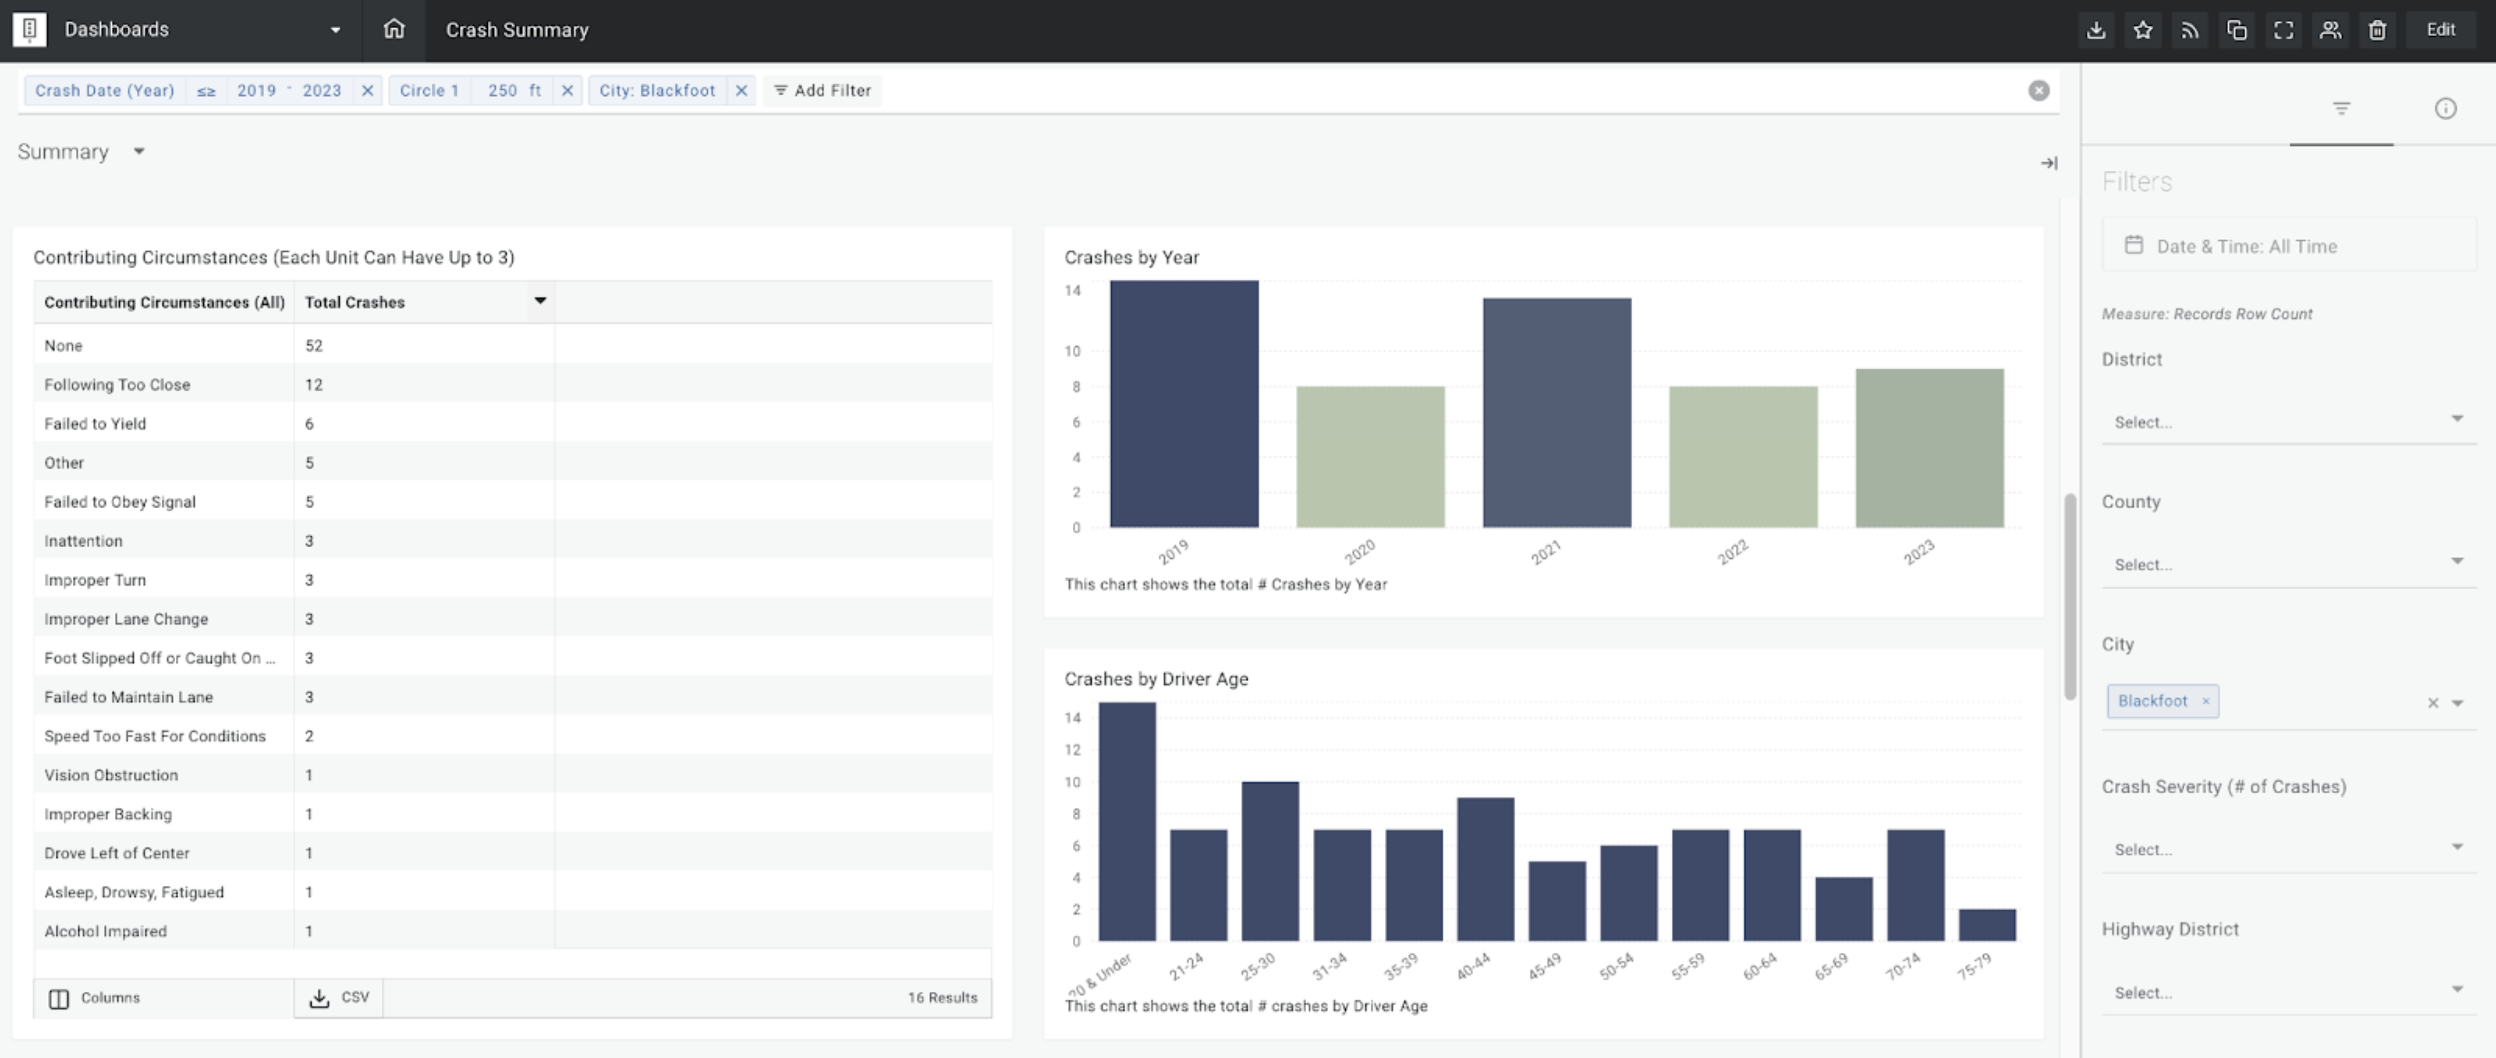
Additionally, users can understand key contributing factors, or patterns in crash data by exploring the crash details for the selected location.
More information on this topic can be found below: