Implementation Effort
- Requires moderate effort
- Timeline between 4-6 weeks
* Assuming an agency has an existing, configured AASHTOWare Safety instance and all required data
Our Customer Success team helps agencies turn crash data into actionable insights. The processes below show how they’re making their communities safer.
The Ohio Department of Transportation used AASHTOWare Safety to support its efforts to meet the USDOT Safe Roads Initiative.
* Assuming an agency has an existing, configured AASHTOWare Safety instance and all required data
Ohio DOT used AASHTOWare Safety to comply with the U.S. Department of Transportation’s National Safe Roads Initiative by quickly developing, sharing, and implementing a data-driven priority list of high-risk non-freeway arterial segments and intersections. The same system was also used to track progress through study, funding, and reporting.
The Safe Roads Initiative, issued by USDOT in July 2025, required State DOTs to identify arterial locations with the highest safety, operational, or compliance concerns and submit this within 60 days. It was also required to develop a plan that addresses these areas by the end of Fiscal Year 2026. The initiative specifically prioritized non-freeway arterials, where more than 50% of roadway fatalities nationwide occur. In Ohio, 45% of all fatalities and serious injuries occur on arterial roads, often within city limits, making this focus directly aligned with existing state safety priorities.
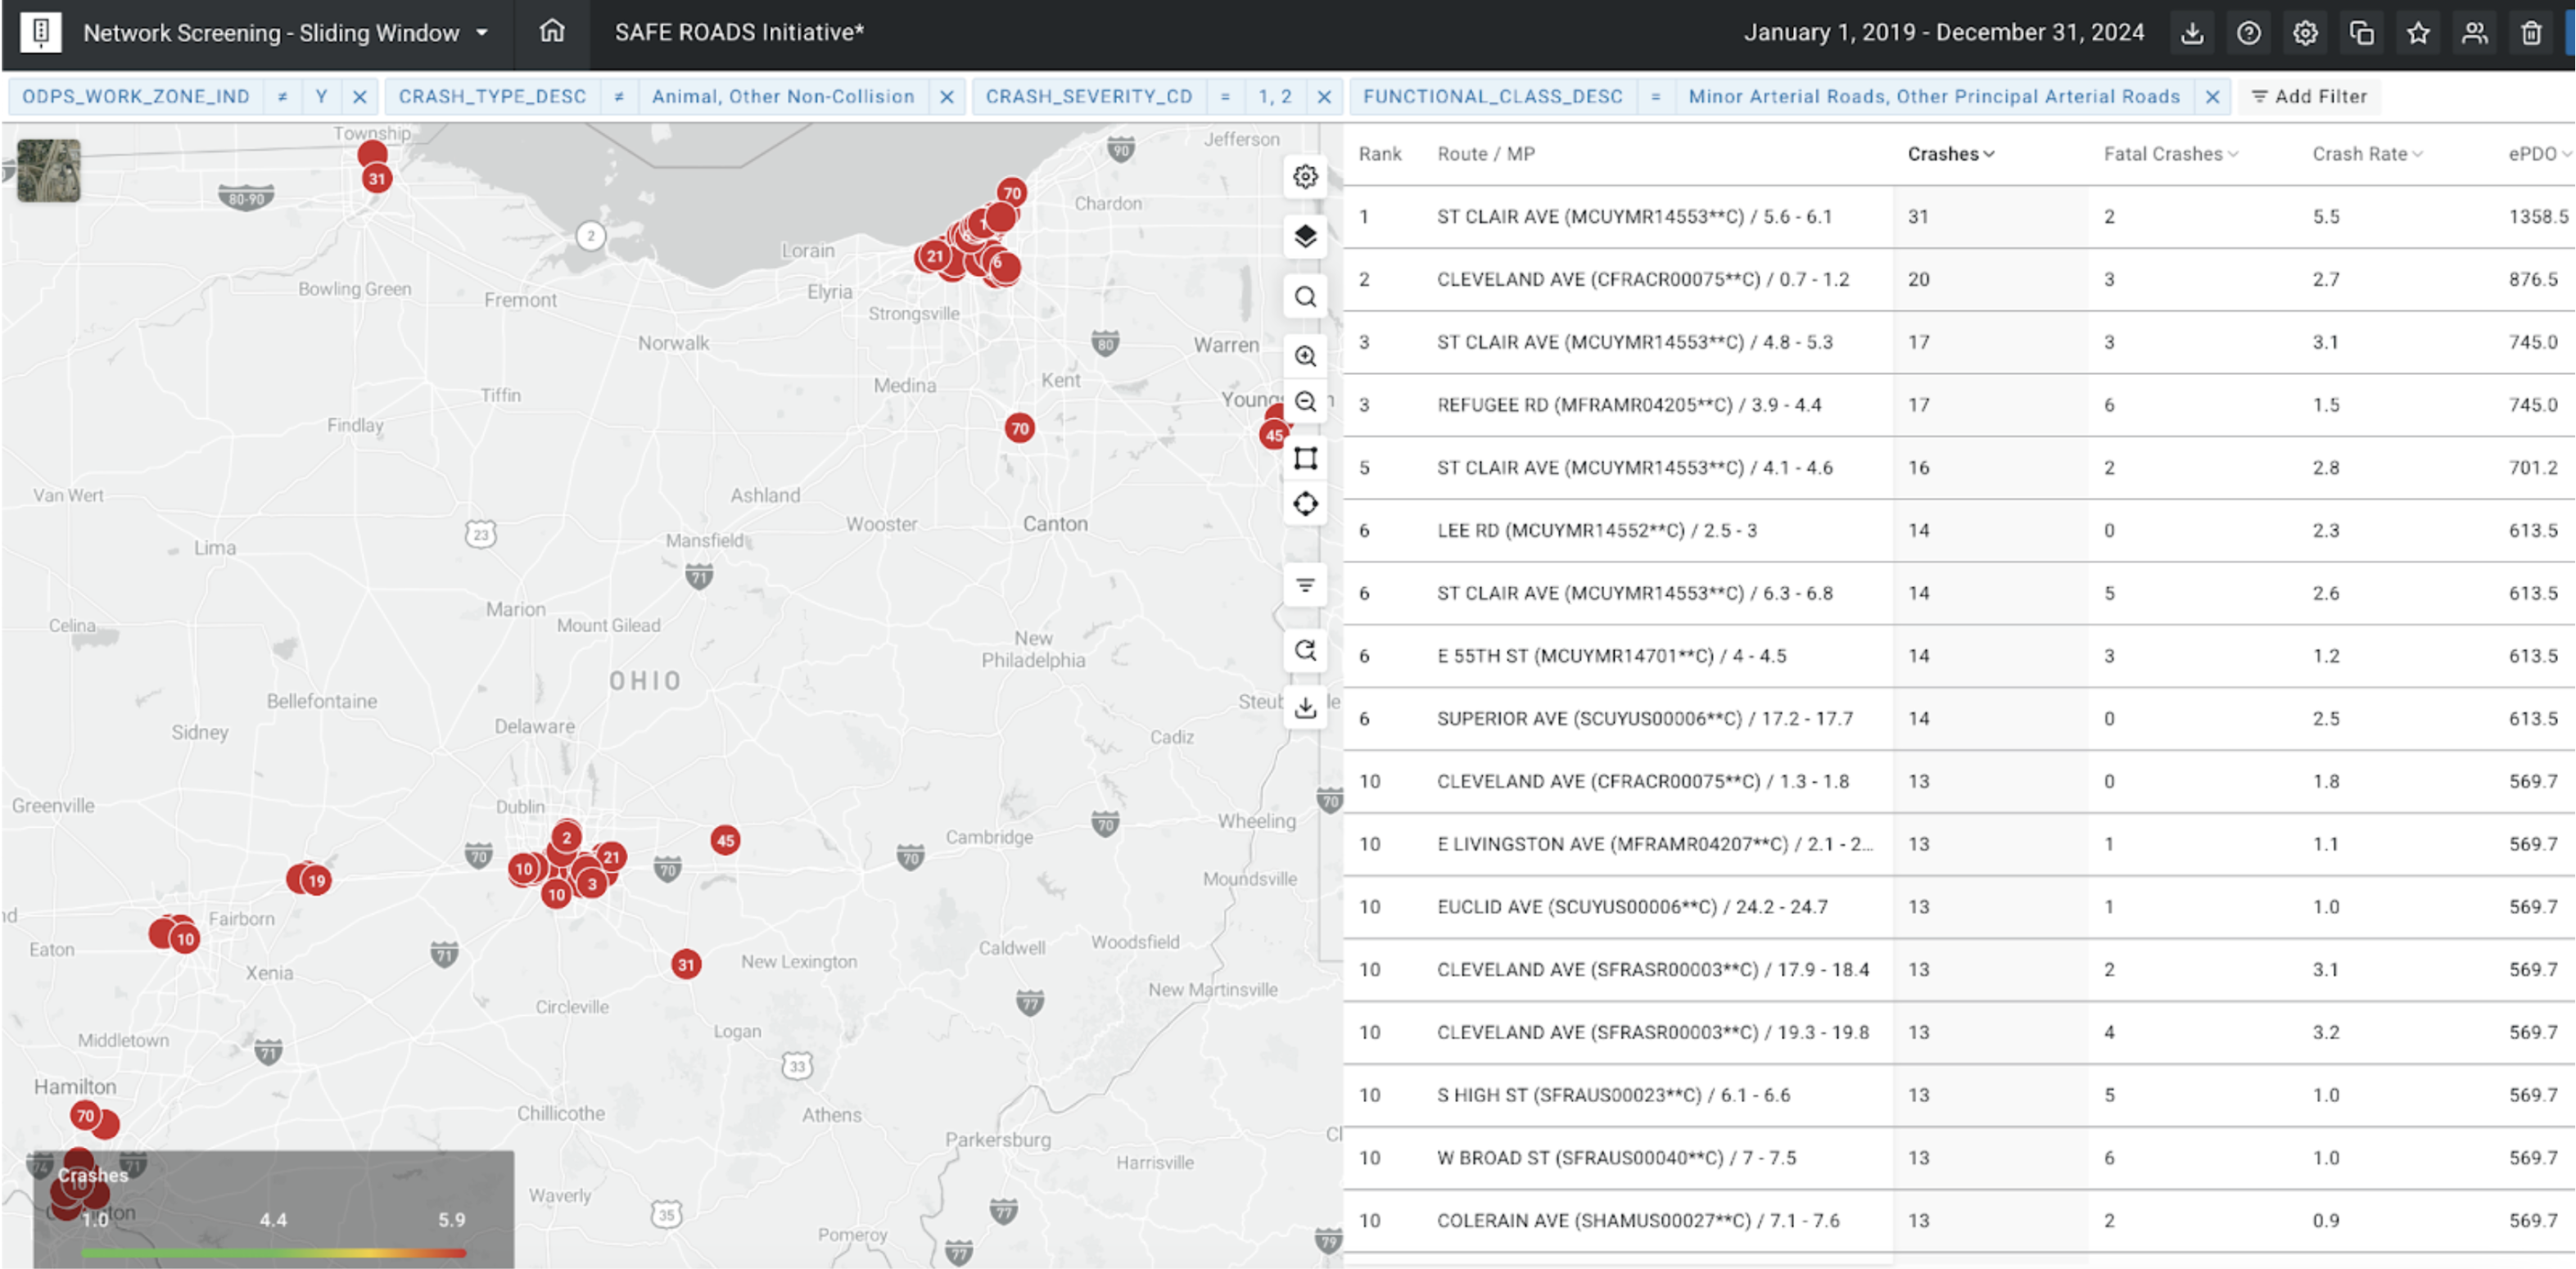
Identifying High-Risk Locations with AASHTOWare Safety
Ohio DOT developed its required priority list using AASHTOWare Safety’s Network Screening – Sliding Window application. The screening was configured to focus exclusively on arterial roadways using .5-mile sliding windows and included intersection crashes along each corridor.
Ohio used crash data from 2019 through 2024, filtered out animal, work zone, and non-collision crashes, and limited the analysis to fatal and serious injury crashes. Locations were ranked based on total crash counts. This approach allowed Ohio to identify continuous high-risk arterial corridors and ensured the results aligned with the federal initiative’s intent.
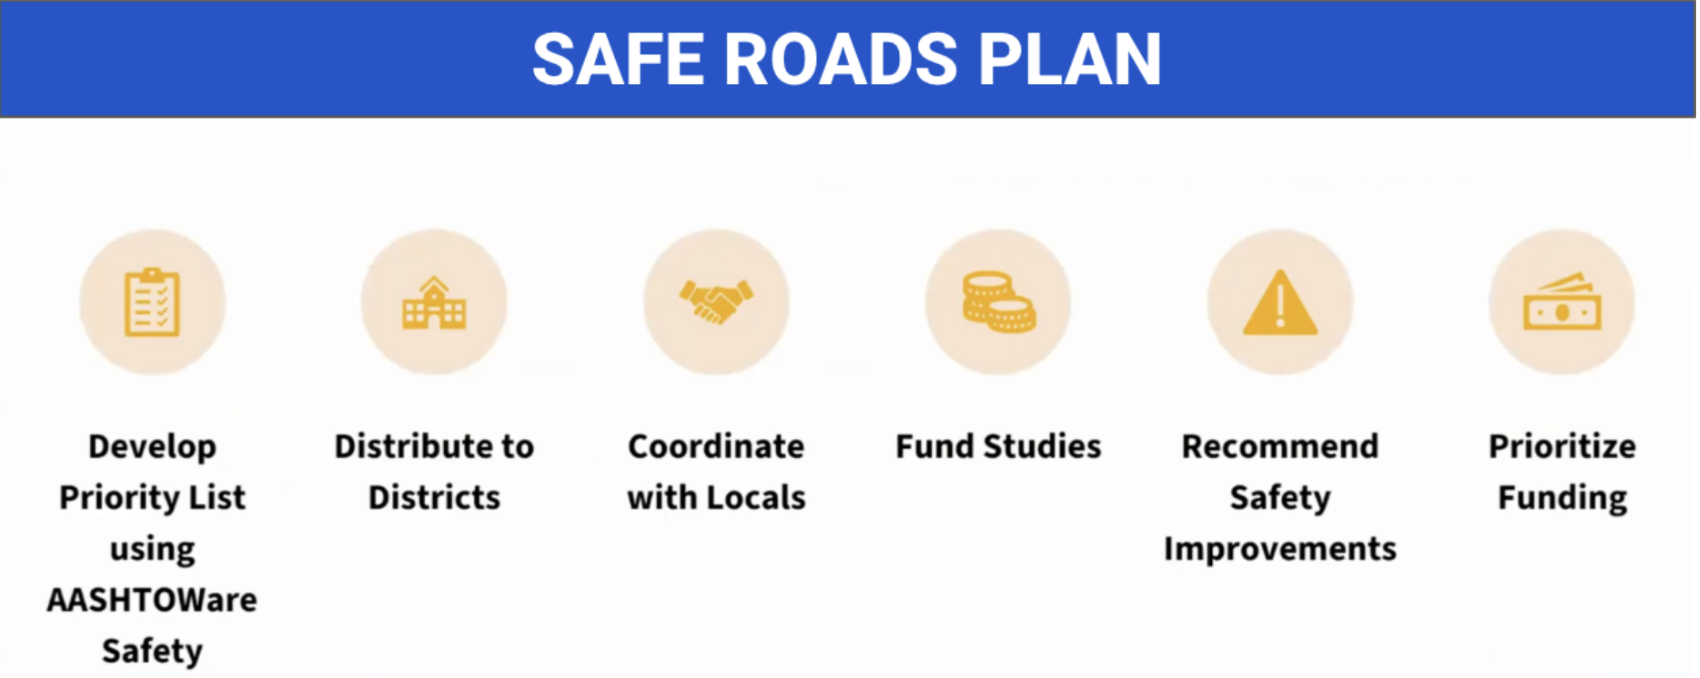
Statewide Distribution and Transparency
Once the priority list was developed, Ohio DOT distributed it to districts for review and then posted it publicly in September. The screening was shared directly within AASHTOWare Safety to more than 900 users statewide. This allowed districts and local partners to interact with the data, review the locations themselves, and understand exactly how the list was created. This transparency supported coordination with local agencies.
After finalizing the list, Ohio DOT moved immediately into implementation. Districts were offered funding for two safety studies each and were asked to coordinate with local governments to identify priority locations from the screening results. Proposed study locations were gathered between October and December 2025. In January 2026, consultants were assigned and studies initiated.
Timeline and Reporting
These studies are scheduled to be completed in the fall of 2026, aligning with Ohio’s next funding application cycle. The identified locations will be prioritized in funding decisions, and Ohio DOT will report progress to FHWA at the required intervals.
Within months of identifying high-risk locations, Ohio DOT had allocated funding, engaged local partners, and launched safety studies. This turned federal data requirements into action to address the state’s problem roadways.
AASHTOWare Safety supported the Ohio DOT’s ability to meet the Safe Roads Initiative requirements by providing a consistent, data-driven framework for identifying, sharing, and advancing priority arterial safety locations. Ohio plans to use the tool to continue supporting statewide alignment and ongoing tracking as the Safe Roads Initiative moves from identification to implementation.
Often, these public outreach initiatives involve tracking and reporting on crash counts, or rates for a given period. Using AASHTOWare Safety, agencies can create custom time-period reporting filters to make reporting on, and tracking crash statistics easier.
More information on this topic can be found below: