Implementation Effort
- Requires moderate effort
- Timeline between 4-6 weeks*
* Assuming an agency has an existing, configured AASHTOWare Safety instance and all required data
Our Customer Success team helps agencies turn crash data into actionable insights. The processes below show how they’re making their communities safer.
The Georgia Department of Transportation partnered with AASHTOWare Safety to build custom Public Portal Dashboards that support various department initiatives.
* Assuming an agency has an existing, configured AASHTOWare Safety instance and all required data
Engaging the public with crash data is crucial to promoting safe driving habits. Making crash data available to the public can be as simple as creating a dashboard with AASHTOWare Safety.
The Georgia Department of Transportation (GDOT) partnered with AASHTOWare Safety to build a custom public Crash Data Dashboard that displays statewide crash data. Dashboards empower users to find the data they need on their own.
AASHTOWare Safety’s customizable public dashboards make it easy to visually represent data and share it with large groups. Agencies can build custom dashboards to visualize different datasets and let users explore the data independently.
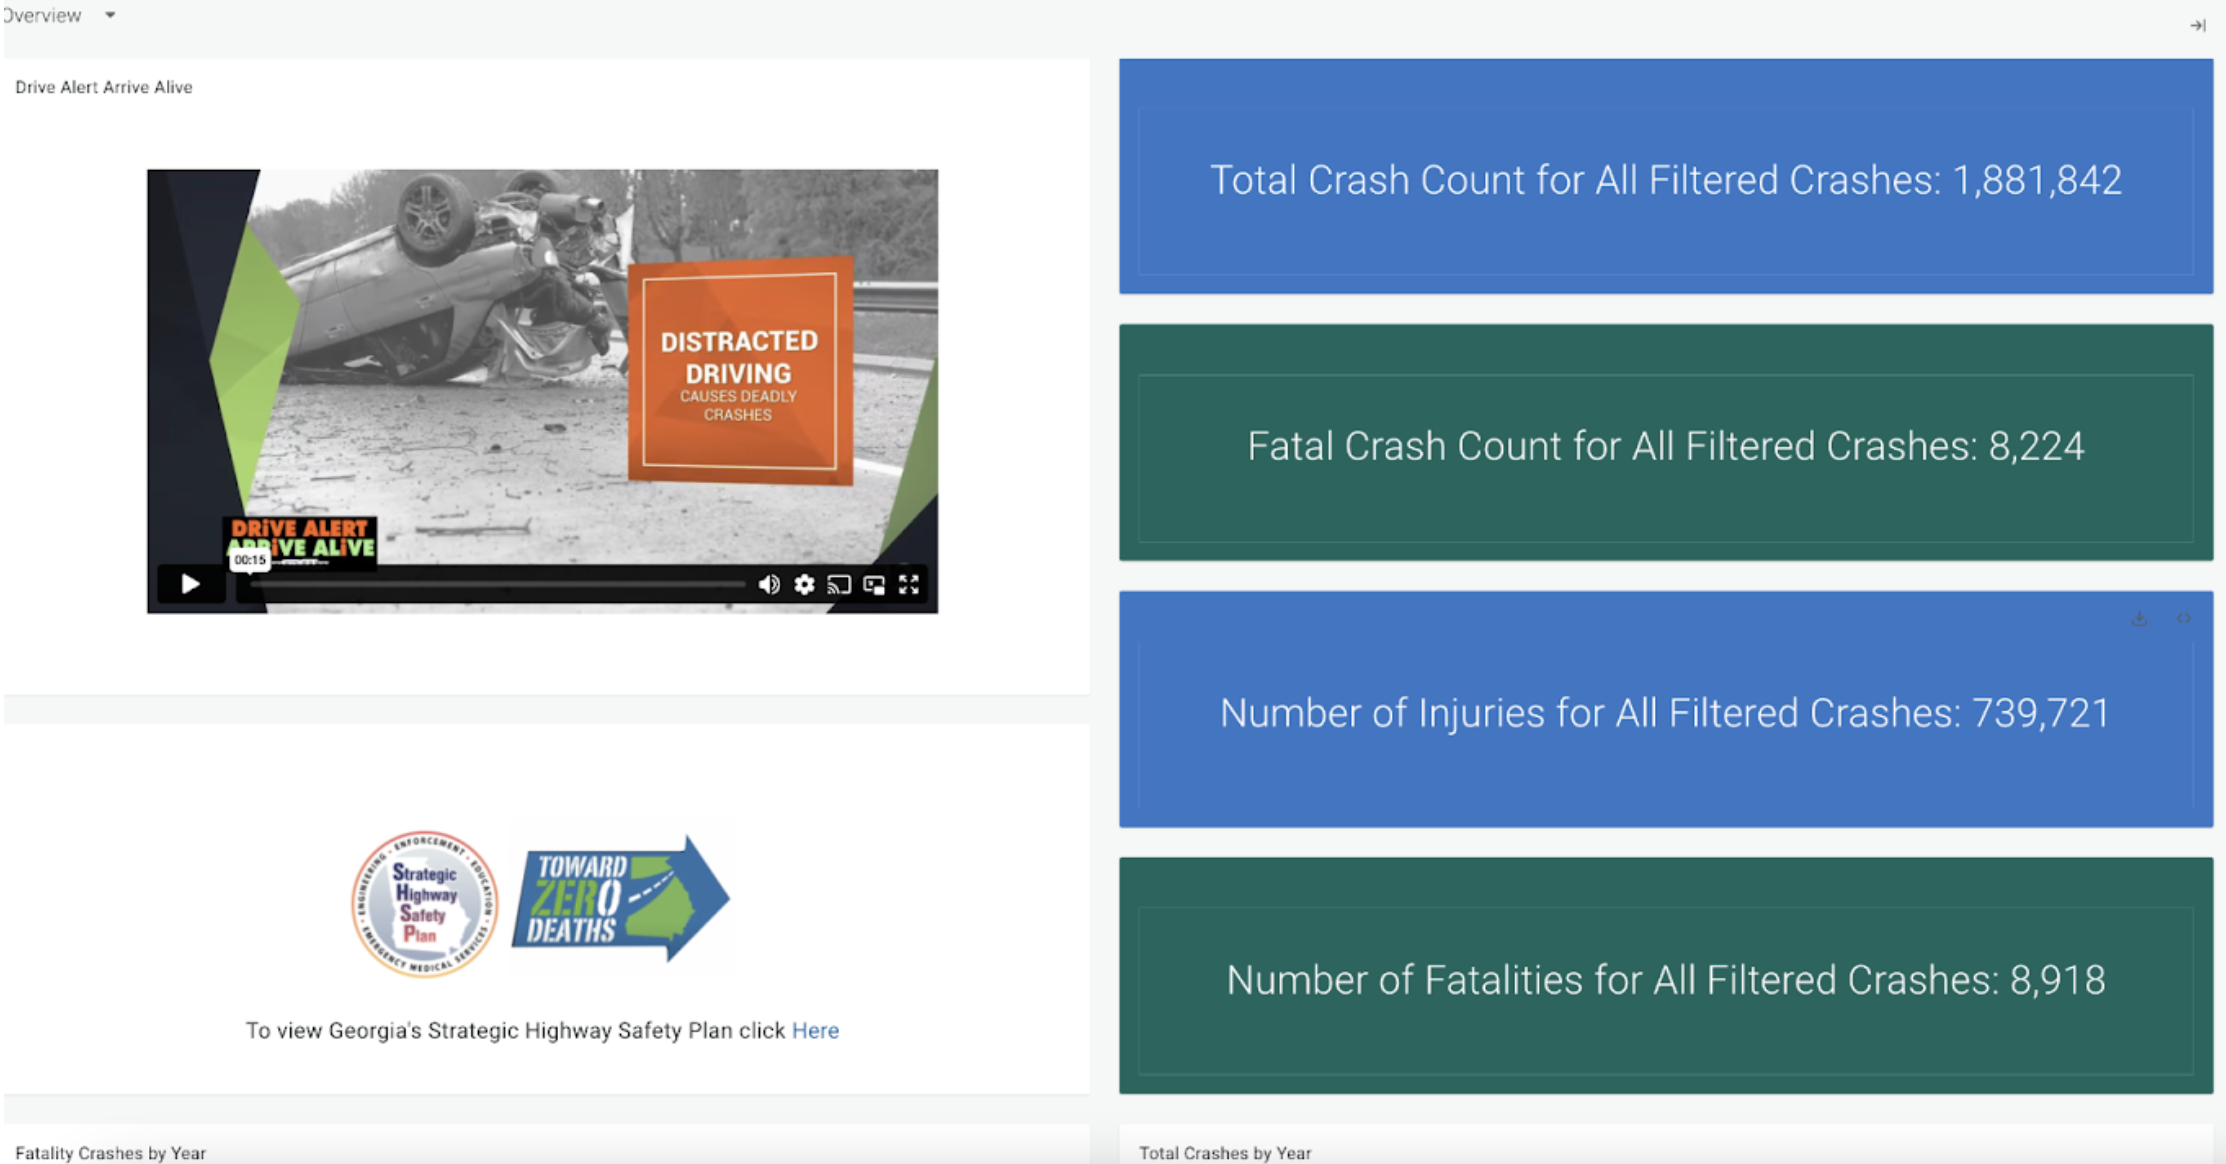
“The GDOT Crash Data Dashboard provides crash and vehicle data from crashes that occurred on Georgia’s public roads, as well as information regarding the various safety campaigns throughout the state of Georgia. This dashboard provides data visualizations, crash mapping, and easy-to-use filtering, which allows you to find the crash data for your city, county, or region. Additionally, crash type filters can help find specific crash types, like pedestrian or bicycle involved, distracted driver related, and more. This dashboard contains crashes that occurred over the last 5 years.”
–GDOT Crash Data Dashboard Overview
In addition to providing crash data to the public, the dashboard also enables GDOT to showcase its various program initiatives, such as the “Drive Alert, Arrive Alive,” “Teens in the Driver Seat,” and “See & Be Seen For Pedestrian Safety” safety campaigns. GDOT’s Crash Data Dashboard lets users easily break down the crash data by highlighting filters such as location, driver age, crash injury severity, and Strategic Highway Safety Plan emphasis areas.
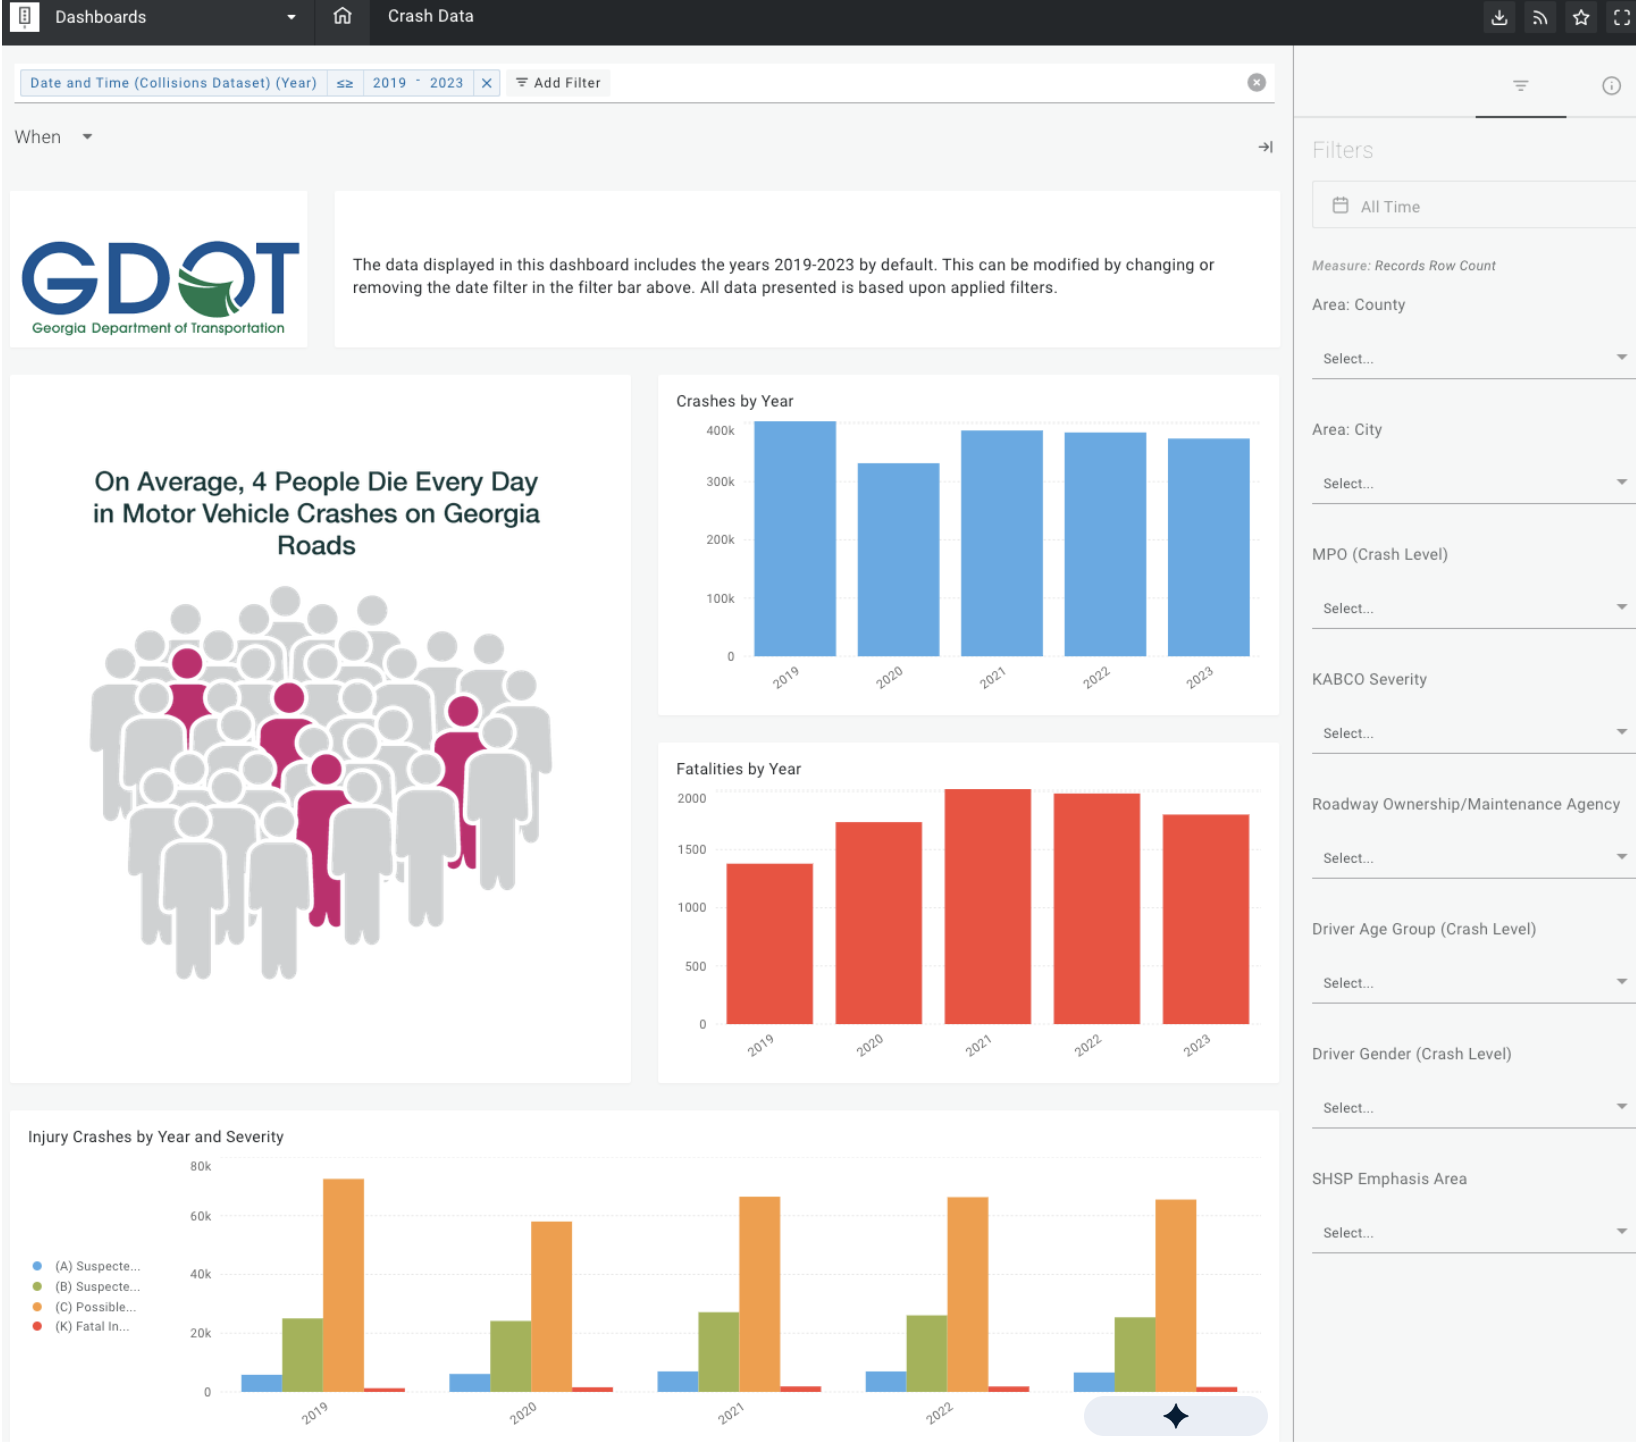
The dashboard also includes a helpful glossary of standard transportation terms to help the general public understand the data they are viewing. This dashboard helps GDOT achieve its goal of making crash data more accessible, both internally and to the public. GDOT’s Public Crash Data Dashboard has been successfully adopted by officials and members of the public alike; it receives 300-400 views weekly.