Implementation Effort
- Requires minimal effort
- Timeline between 2-3 weeks*
* Assuming an agency has an existing, configured AASHTOWare Safety instance and all required data
Our Customer Success team helps agencies turn crash data into actionable insights. The processes below show how they’re making their communities safer.
The Nebraska Department of Transportation used AASHTOWare Safety to identify data quality issues and work to resolve them.
* Assuming an agency has an existing, configured AASHTOWare Safety instance and all required data
Accurate data is essential to meaningful safety decisions, enforcement priorities, and infrastructure investments. The Nebraska Department of Transportation (NDOT) initially believed its crash, roadway geometry, traffic volume, and location data were accurate and sufficient to support analysis. Data quality evaluation was not originally a goal of purchasing AASHTOWare Safety. However, once the data was visualized in the platform, issues that had gone unnoticed in tabular reports became immediately apparent. This unforeseen benefit revealed location errors, inconsistencies in crash reports, and gaps in traffic volume data, clearly identifying areas for possible correction.
The ability to view the crash data spatially changed how it was understood and discussed within NDOT. This made discrepancies easier to identify and encouraged collaboration across departments. By sharing access to AASHTOWare Safety, teams could run the same queries, view the same results, and develop a shared understanding of where the data was strong and where it needed improvement. This common view enabled coordinated conversations about data quality that had not previously occurred.
Target Enforcement with Confidence
Visualization highlighted a critical data quality issue in crash reporting. In multiple crash records, officers cited disregard of stop signs as a contributing factor, while the traffic control fields indicated yield signs or no traffic control. NDOT identified inconsistencies, determined which reporting agencies were responsible, and coordinated targeted education to improve the accuracy of field-collected crash reports.
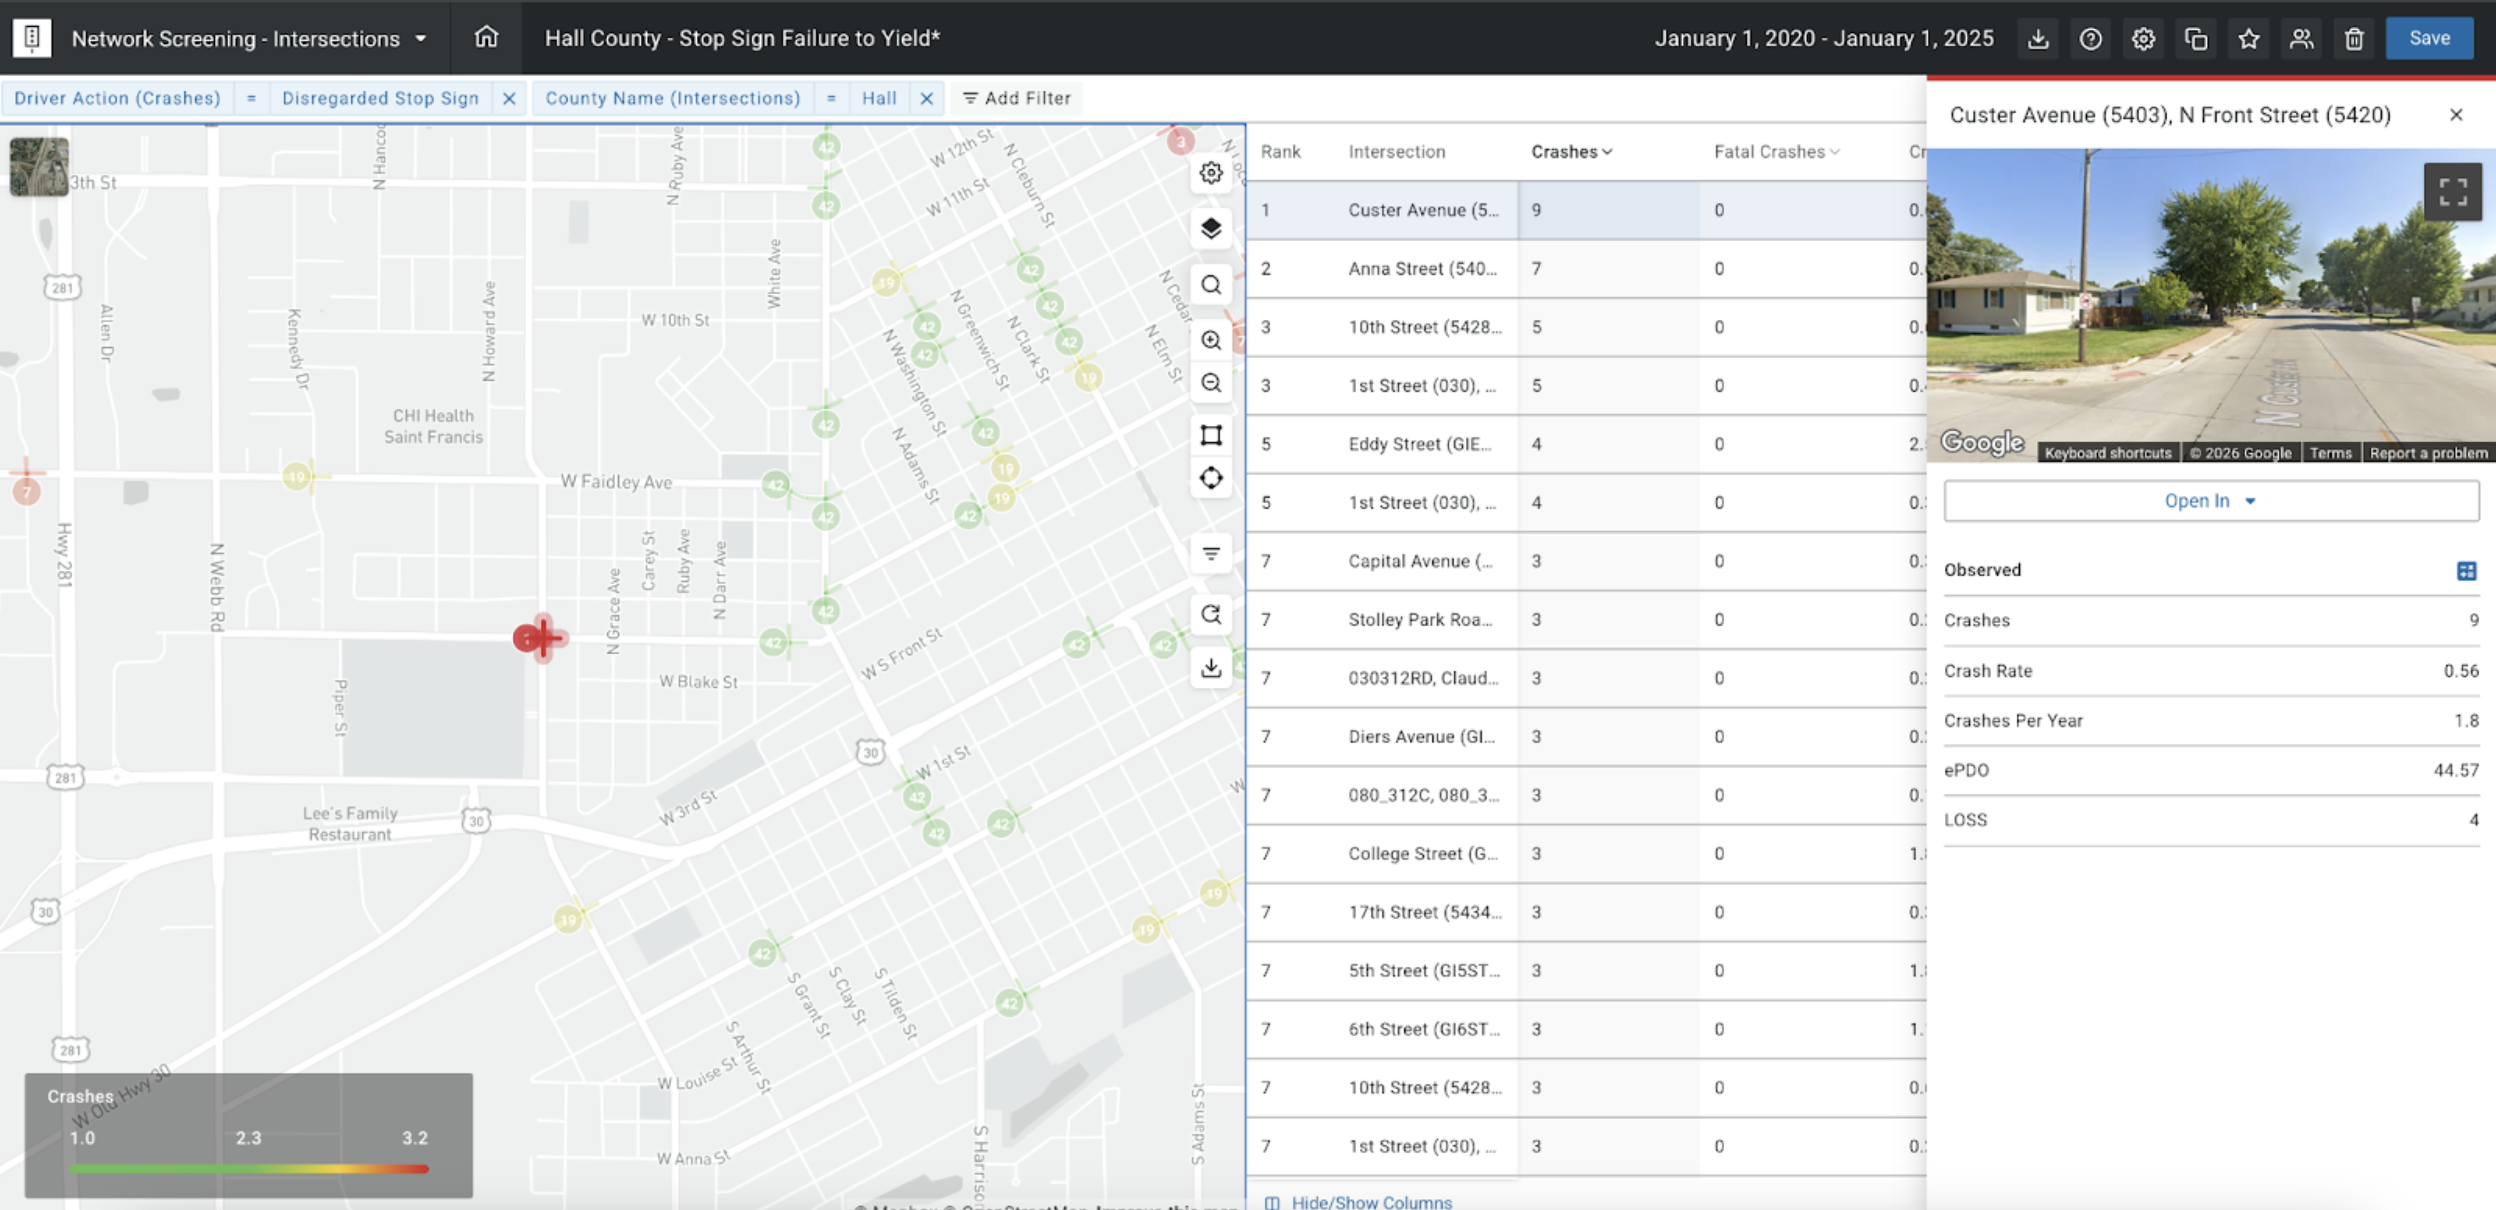
With this issue resolved, NDOT could confidently use the corrected data for enforcement planning. For example, a Network Screening in Hall County identified and ranked failure-to-yield crashes at stop signs. With this information, officers can focus enforcement efforts on these locations.
In Kearney, inconsistencies in how crashes were coded initially made it difficult to identify patterns in red-light-running incidents. By giving the right teams shared access to the same visualized crash data, inconsistencies were identified and corrected. With reliable crash data, teams can more accurately identify intersections with recurring red-light-running incidents. These insights supported targeted enforcement and public education efforts focused on specific high-risk locations.
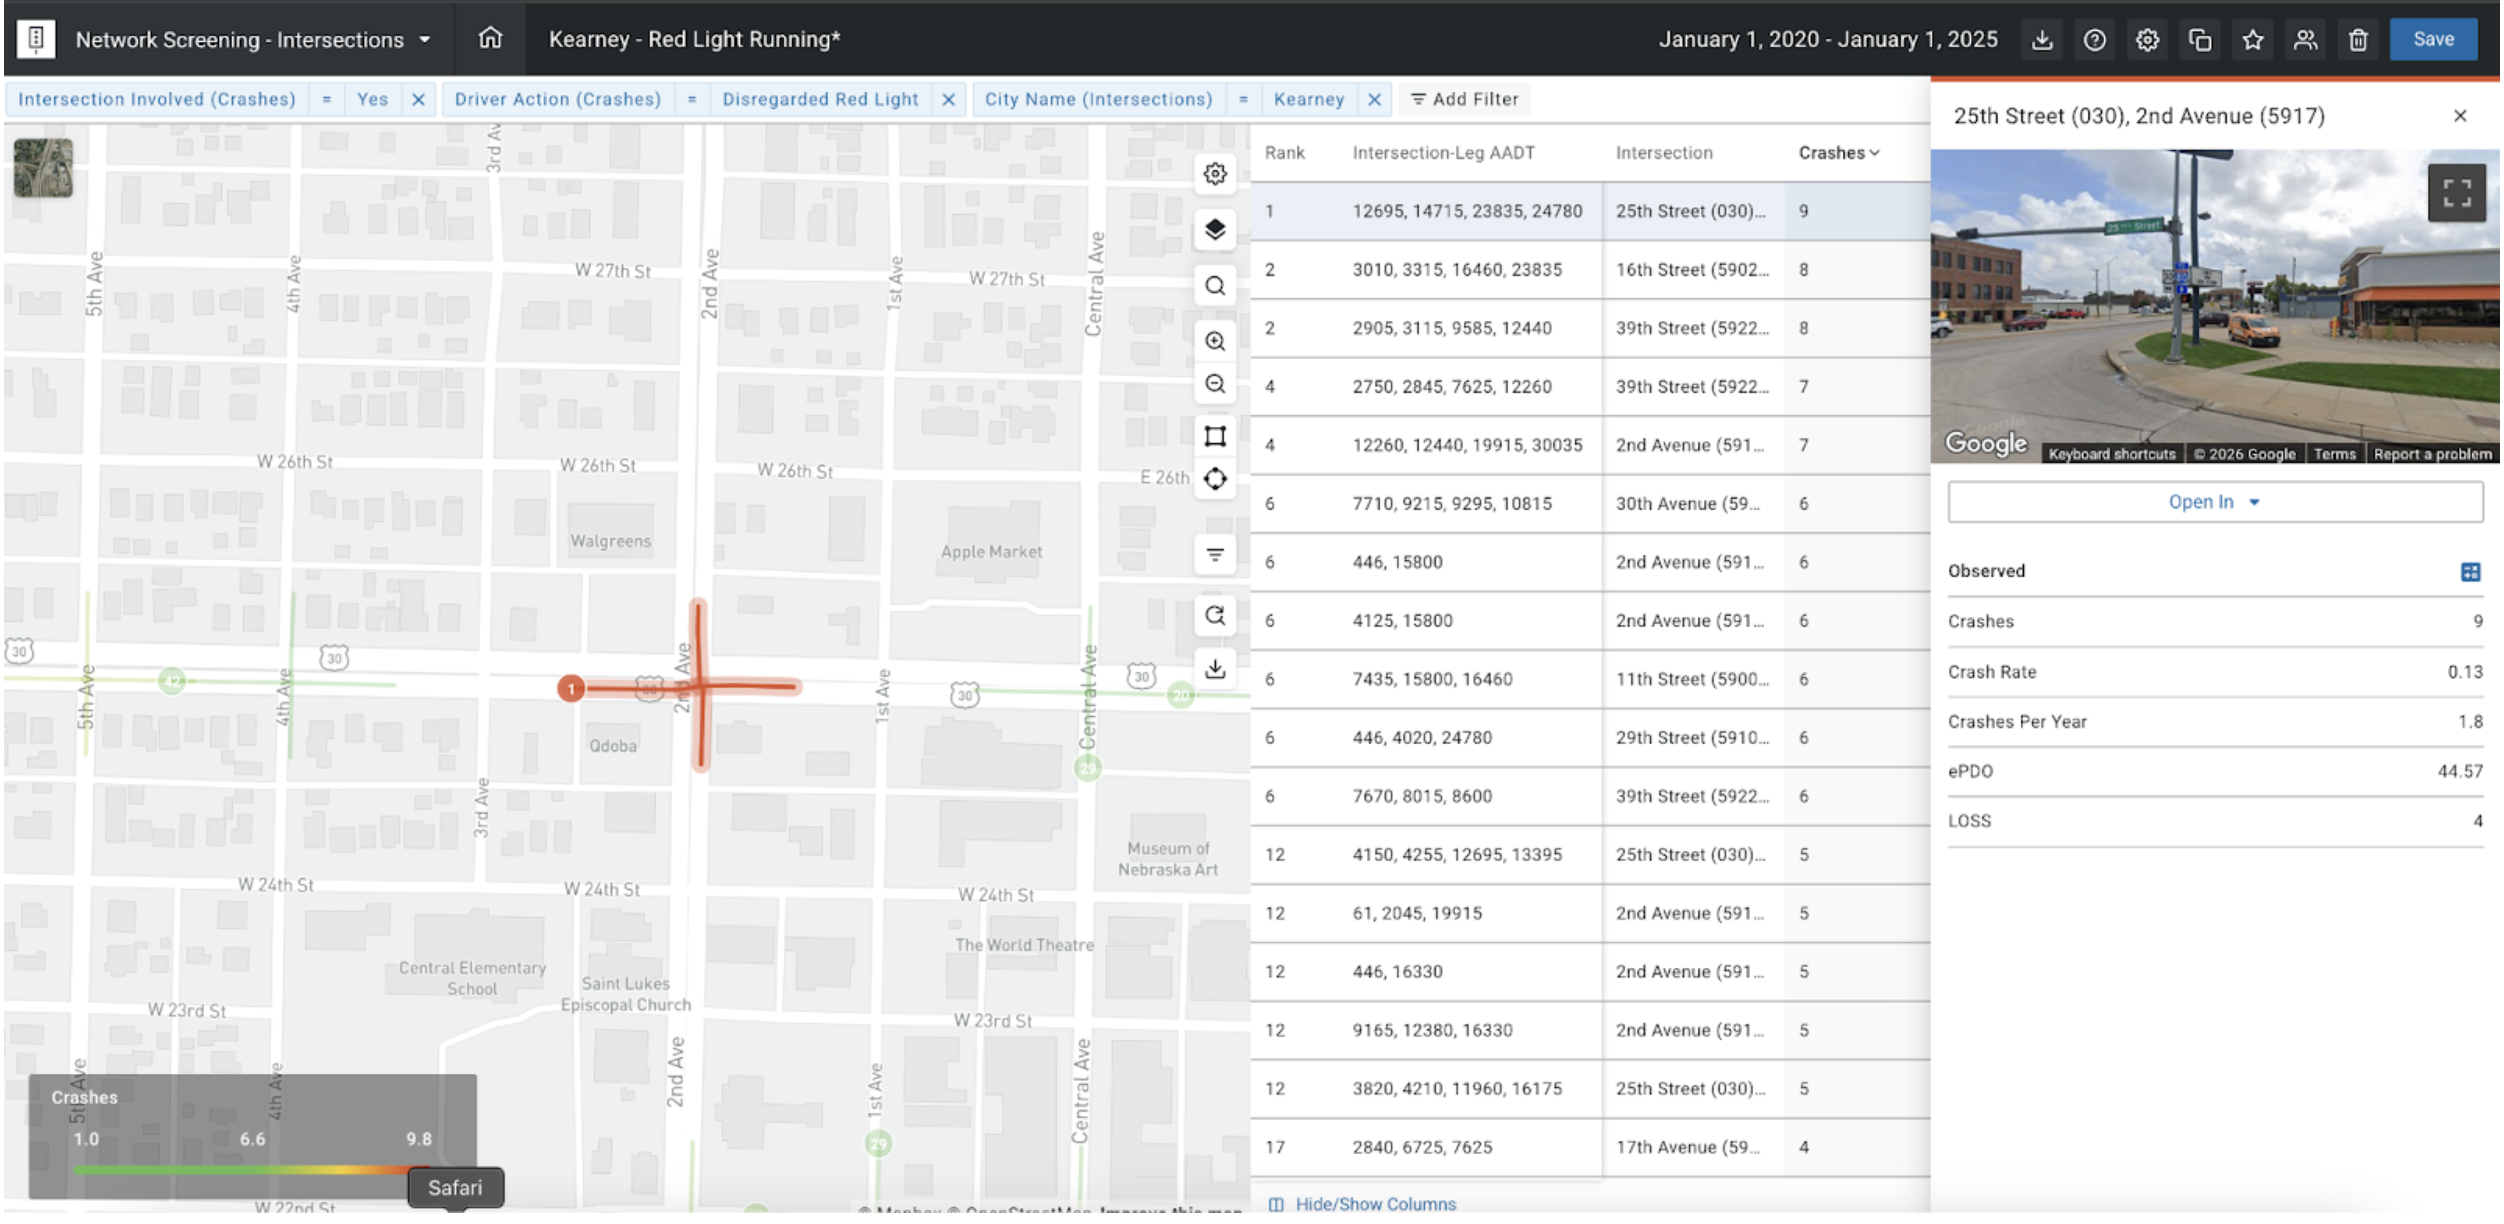
Enforcement focus became a data-informed, collaborative process supported by accurate information. With reliable data in hand, the agency coordinated with local law enforcement to focus enforcement efforts on locations with the highest crash frequency, ensuring resources were directed to the areas with the greatest impact. With improved accuracy in officer reporting, this targeted approach became possible.
Identifying Additional Data Gaps
It was also discovered that some roadways lacked traffic volume data despite known counts, which would have directly affected crash rate calculations. Missing volume data prevented accurate evaluation of some corridors. It was simple to view the roadways with missing AADT data in AASHTOWare Safety. This enabled collaboration between crash analysts and the teams responsible for traffic counts; these gaps were quickly identified and filled. Having shared access made it straightforward to correct.
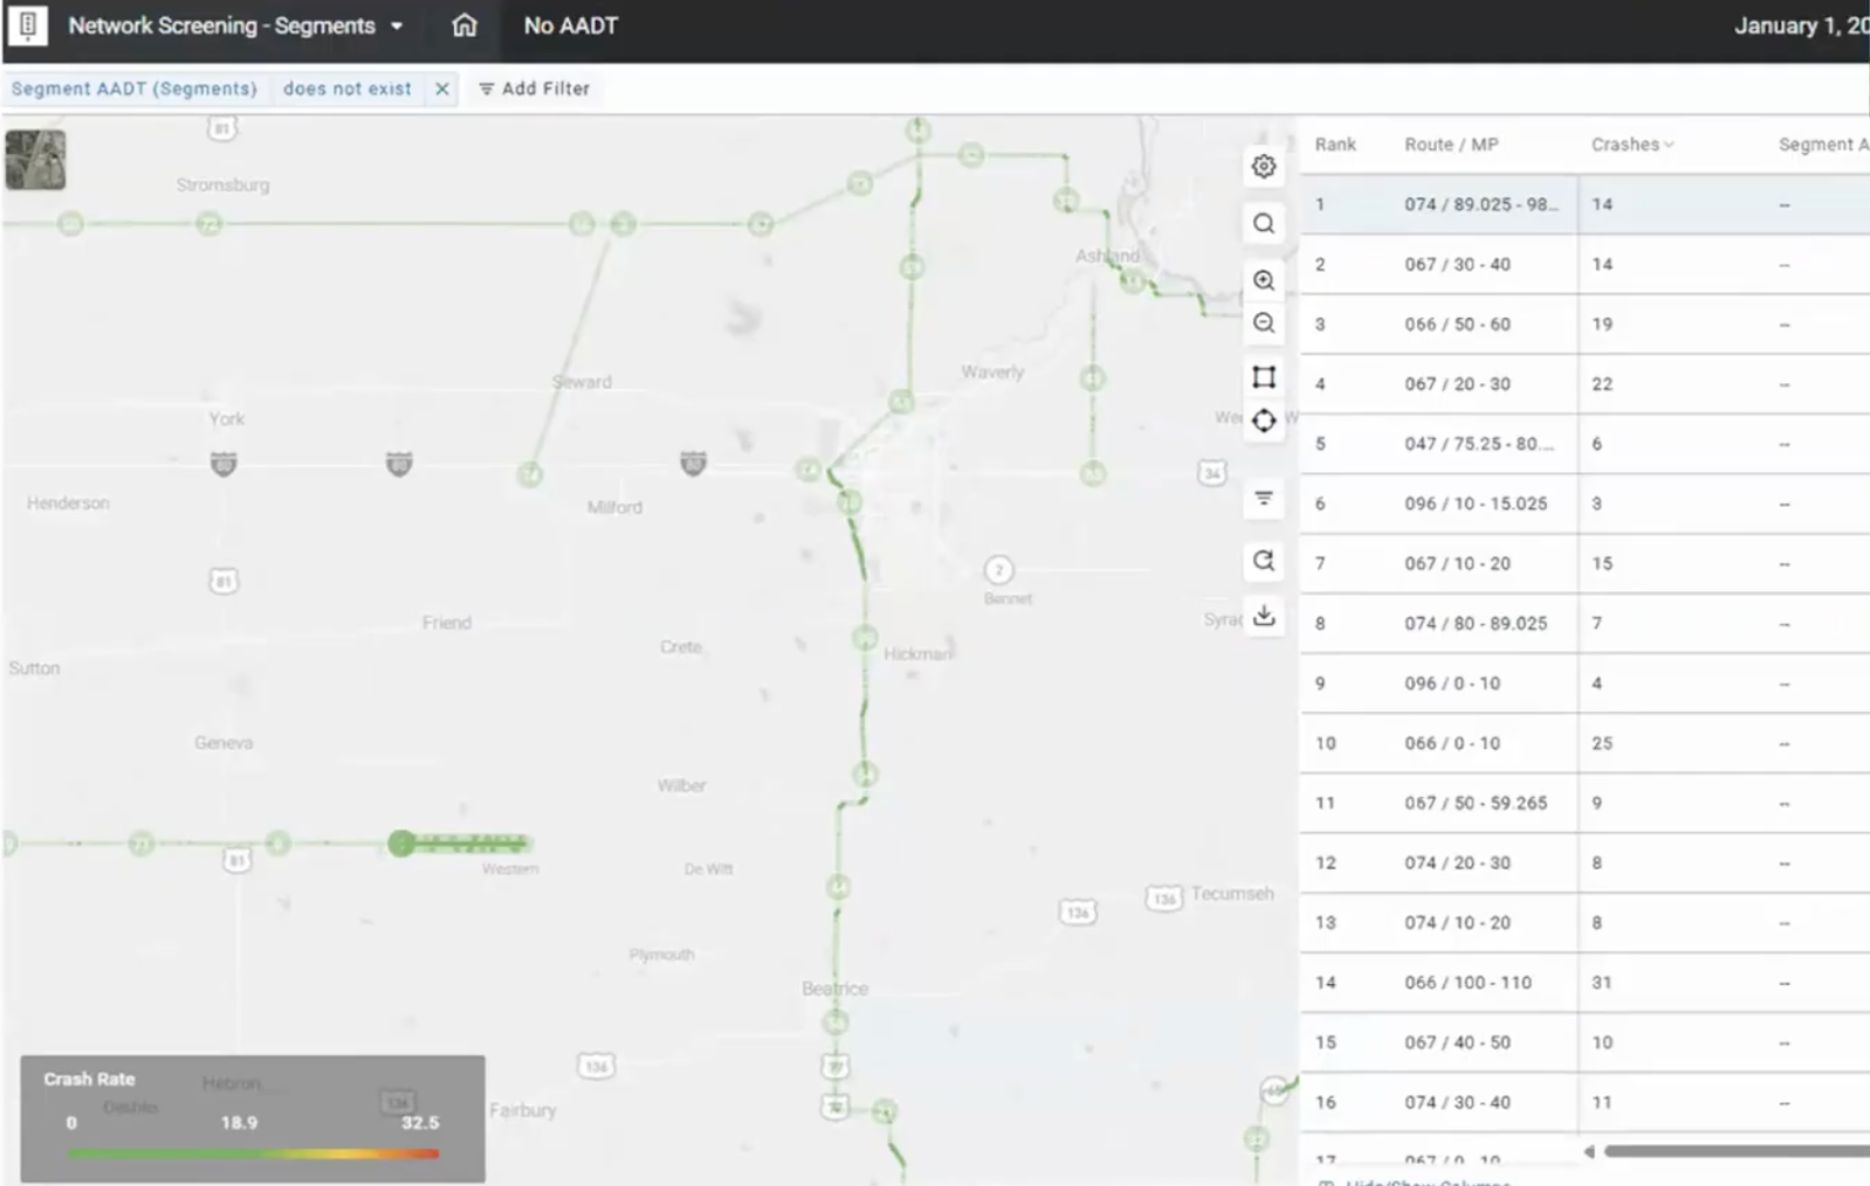
With complete data, NDOT could calculate reliable crash rates and prioritize corridors based on actual risk rather than incomplete information. Rural angle crash data, for example, was used to evaluate potential roundabout candidates. At one location, an intersection with multiple stop signs and a high number of crashes stood out clearly in the analysis. With accurate data, planners could evaluate locations systematically and consider a roundabout a safer alternative, rather than relying on assumptions or incomplete records.
Impact: Discovery to Action
By visualizing safety data in AASHTOWare Safety and providing unlimited access to teams across the agency, NDOT identified data issues they had not previously recognized. Moving from tabular formats to visual analysis revealed previously undetected issues and enabled a coordinated approach to improving data quality. Shared access meant corrections weren’t siloed in a single department. Everyone worked from the same information, supporting more efficient problem-solving and greater confidence in the results. Resolving these data issues enabled the department to make meaningful safety decisions.
More information on this topic can be found below: